Monitoring
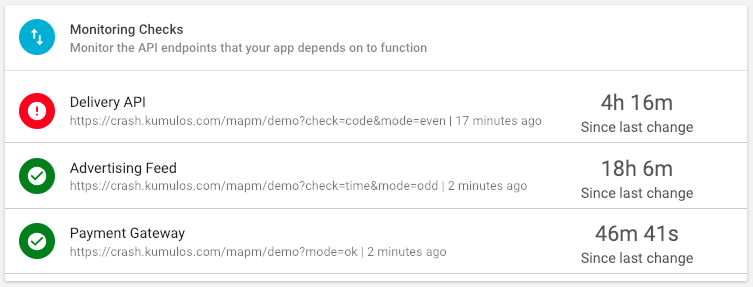
Monitoring Checks to track the performance of the services your app depends on to function. Are all API Endoints reachable? Returning the correct response code? Returning data to your app in the expected format? And how long do they take to do this? Monitoring checks will alert you to any problems before they impact your audience.
Select the App, expand "Diagnostics" and select "Monitoring Checks" in the left hand menu.
If you have a lot of endpoints you want to monitor, click "Contact Us" to arrange to send us a Postman collection or Swagger/OpenAPI spec and we'll import them for you.
Add a Monitoring Check
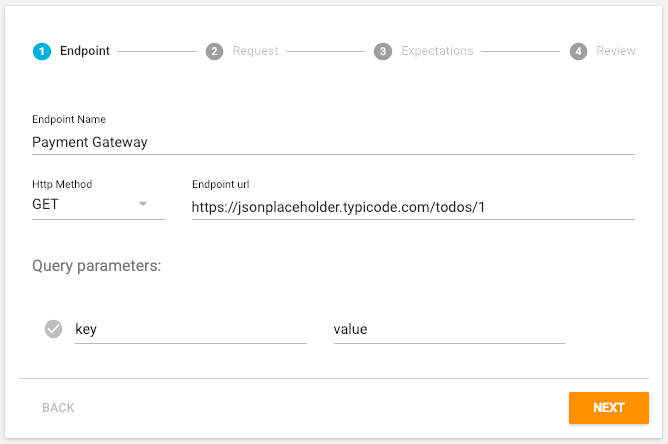
To start monitoring an API Endpoint, click the primary action button.
Give the endpoint a descriptive name, select the HTTP Method (GET, POST, PUT, DELETE or PATCH), enter the URL and any query parameters (as key, value pairs). Click "Next" when done.
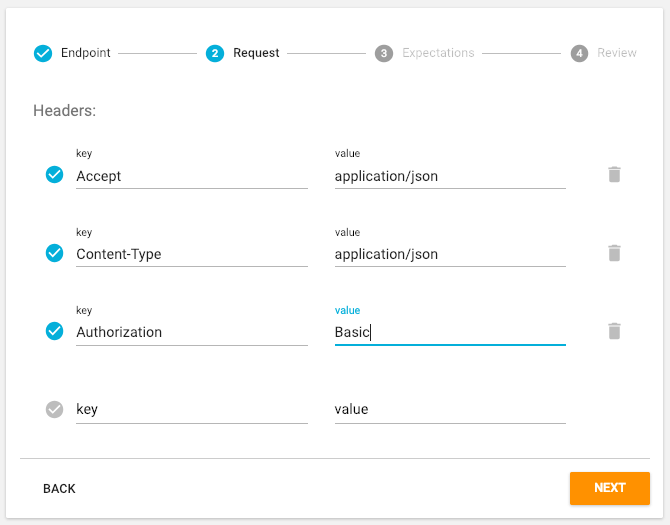
Add any HTTP headers to the Request such as an Authorization header and click "Next".
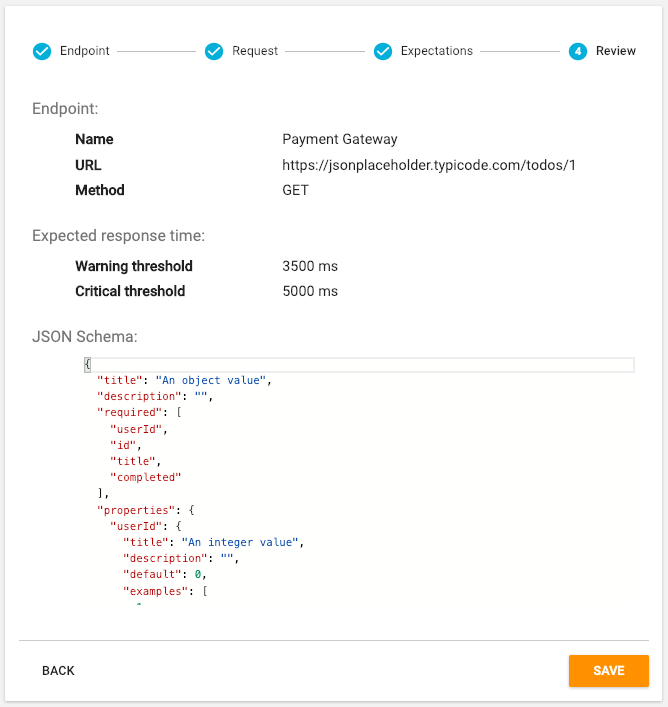
In addition to testing that the API Endpoint is Reachable and returning a successful 2xx Response Code, the Monitoring Check will test how long the API Endpoint takes to respond to the HTTP Request from each Data Centre. Specify a Warning and Critical threshold for Response Time in milliseconds.
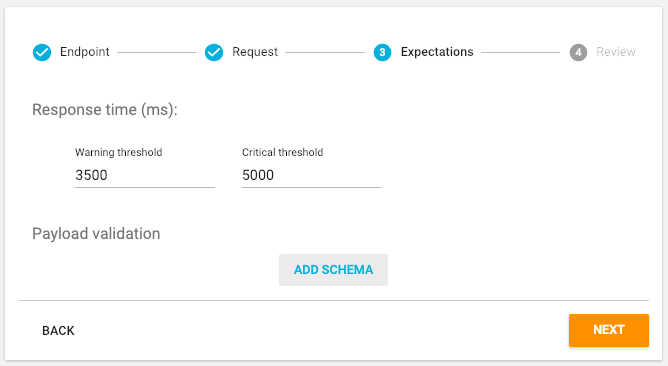
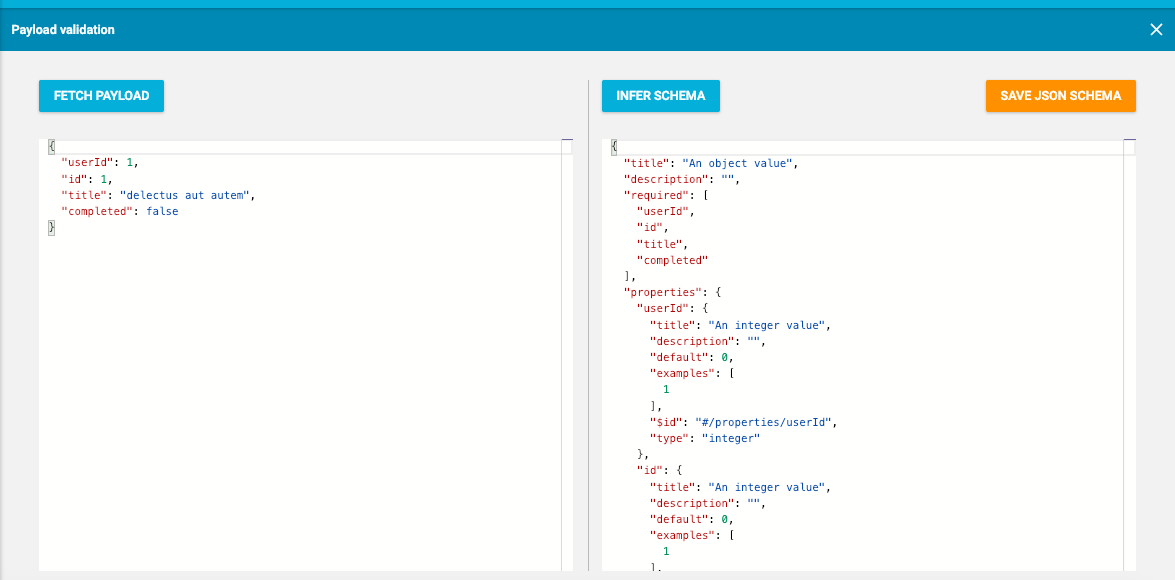
If you also want the Monitoring Check to test that the payload returned validates against a JSON schema, click the "Add Schema" button.
You can enter a JSON schema manually into the right-hand pane, but it is simpler to infer the JSON schema from the actual response body of the API Endpoint itself. Click "Fetch Payload" to execute the HTTP Request and then "Infer Schema" to derive the JSON schema from the response. You can manually edit the schema if required. Click "Save JSON Schema" when done and then "Next".
You can now review everything entered and click "Back" to make any changes. Click "Save" to add the Monitoring Check.
The Monitoring Check will now be added and results will appear within the next 5 minutes.
View Detailed Results
To view detailed results, click on the Endpoint in either the table in the Diagnostics Dashboard or the Monitoring Checks page (expand "Diagnostics" and select "Monitoring Checks" in left hand menu).
The results will automatically refresh every 5 minutes.
Endpoint Status
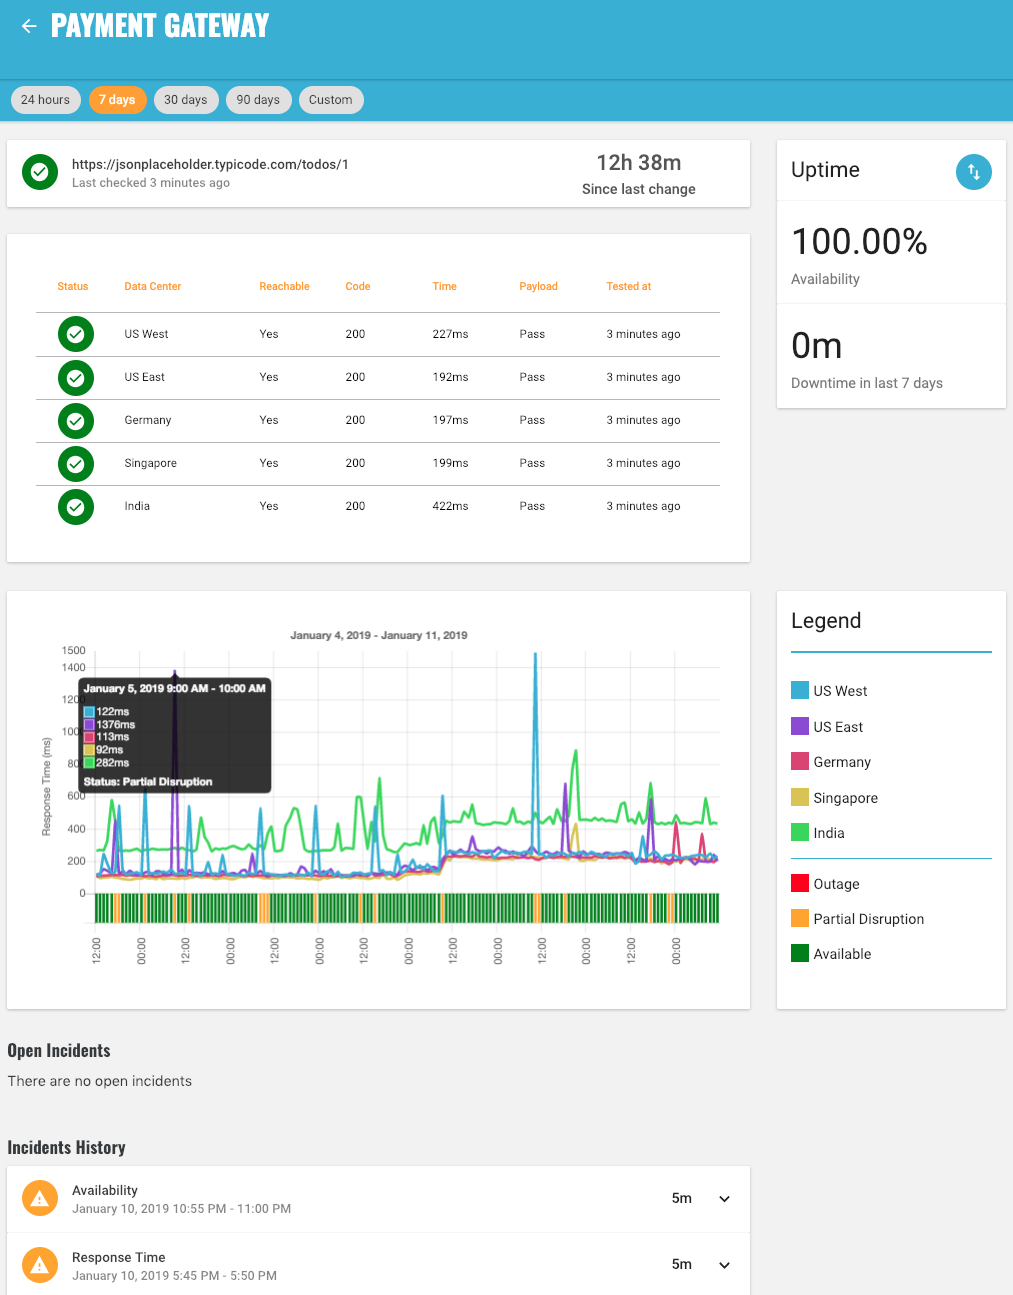
The overall Endpoint Status and how long the Endpoint has been in that status is shown at the top.

For the Endpoint Status to be 'Available' (green), all tests from all Data Centers must be OK.
If a test from one Data Center is Crtical, the Endpoint Status will be 'Partial Disruption' (yellow) as the problem is localised to one region (i.e. the other Data Centers are OK for the same test).
If a test from two or more Data Centers is Critical, the problem is obviously more widespread and the Endpoint Status will be 'Outage' (red).
| Endpoint Status | Description |
|---|---|
| Available | All Tests from all Data Centers are OK |
| Partial Disruption | One Data Center is Critical (for any Test) One or more Data Centers are Warning (for Response Time) |
| Outage | Two or more Data Centers are Critical (for same Test) |
Uptime
Uptime shows the percentage of time that the Endpoint Status was Available during the selected time period as well as the absolute downtime (when Endpoint Status was Outage) over same time.
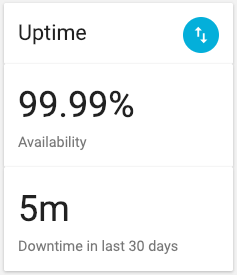
By default, this will show the last 24 hours, but can be changed to the last 7 days (1 week), 30 days (1 month) or 90 days (1 quarter). Alternatively, select Custom and enter a start and end date to see this over a period of time up to 180 days (6 months).
Tests
Detailed results for each Test from each Data Center are shown.
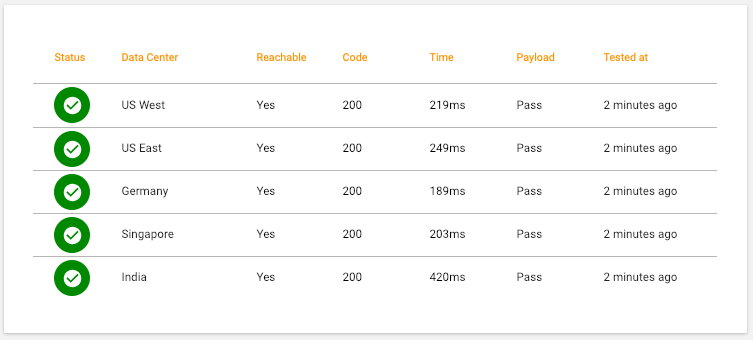
Data Centers are ordered in the table by Status with those Data Centers that have a Critical test or a Warning test appearing first. For each Data Center, the detailed results of each test will be shown.
| Test | Status | Description |
|---|---|---|
| Reachable | OK | HTTP Request successfully made |
| Critical | Network error prevented HTTP Request | |
| Response Code | OK | Response Code was 2xx (Success) |
| Critical | Response Code not 2xx e.g. 4xx (Client Error) or 5xx (Server Error) | |
| Response Time | OK | Response received before Warning Threshold (e.g. 3500 ms) |
| Warning | Response received after Warning but before Critical Threshold | |
| Critical | Response received after Critical Threshold (e.g. 5000 ms) | |
| Payload | OK | Response body passed validation against saved JSON schema |
| Critical | Response body failed validation against saved JSON schema |
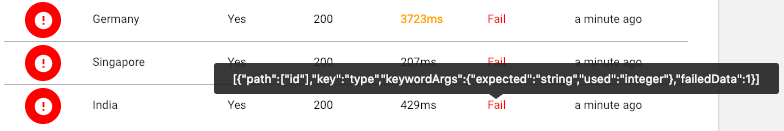
Any tests that are Critical will be shown in red. Hover over that test to see a tool-tip with the reason such as the network error (e.g. TLS handshake failed) or the JSON path that failed validation.
Response Time
The chart shows how long on average it took each Data Center to receive a response to the HTTP Request from the Endpoint along with the worst Endpoint Status for each interval on the chart.
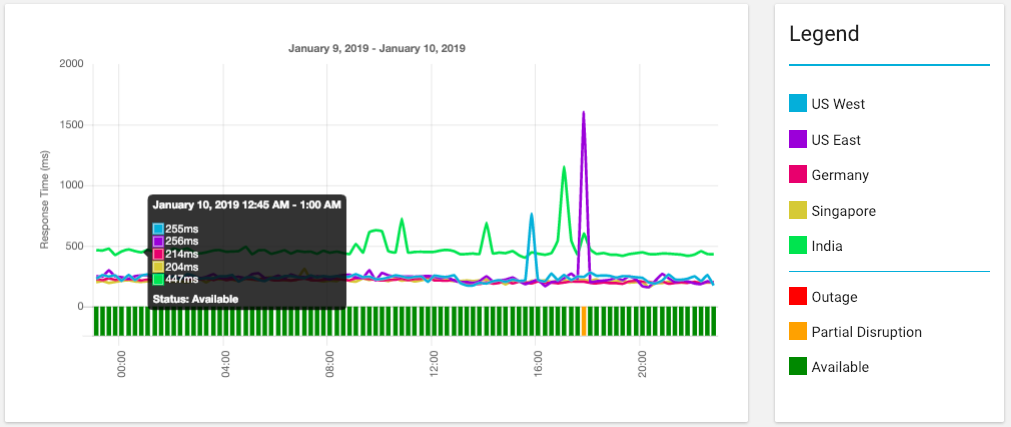
By default, the chart will show the last 24 hours at 15 minute intervals. This can be changed to the last 7 days (with hourly intervals) or 30 and 90 days (with daily intervals). Alternatively, select Custom and enter a start and end date to see this over a period of time up to 180 days (6 months).
Hover over any interval on the chart to see the average response time for each data centre during that interval as well as the worst Endpoint Status during that interval.
Soon you will be able to drill down and see how the Response Time is comprised i.e. how much time was spent on DNS Resolution, Transfer etc and how this varies over time.
As response times shown are the average for that interval, it is possible that the EndPoint Status can be Partial Disruption or Outage caused by a slow Response Time for a test that exceeds a threshold, but that the average for the interval is under the threshold. In which case, look at the corresponding incident to see more details.
Incidents
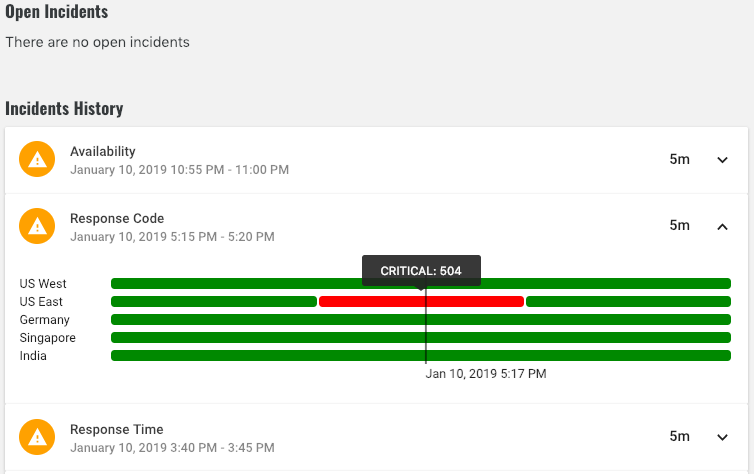
Incidents show any current problems as well as a history of all past problems with an API Endpoint.
If a Test is not OK, an Incident will be opened and will remain open until that Test is OK for all Data Centers. However, if the same Test is not OK from multiple Data Centers, then only one Incident will be opened. Click on the Incident to see a timeline for each Data Center and hover over to see exact failure reason.
New incidents will be opened for the most important test only. For example: if an Incident is opened because Response Code is Critical, an Incident will not be opened for Payload validation etc.
However, if an Incident is already open for one Test e.g. Response Time and later a more important Test e.g. Response Code becomes Critical, the Response Time Incident will remain Open and a new Incident for Response Code will also be opened. The Response Code Incident will be closed when Response Code is OK for all Data Centers and then the Response Time Incident will be closed when Response Time is OK for all Data Centers.
Open Incidents will show the current worst Test Status for any Data Center whereas Closed Incidents will show the worst Test Status at any point during the Incident.
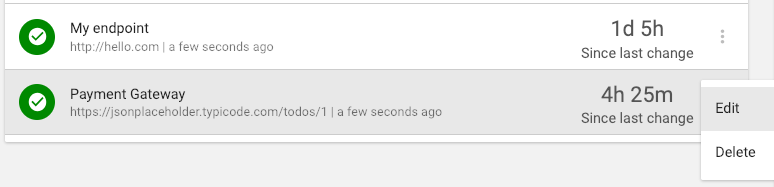
Edit a Monitoring Check
To edit any of the Endpoint details (such as request headers), warning and critical thresholds or the JSON schema, first select the App, expand "Diagnostics" and select "Monitoring Checks" in the left hand menu. Expand the context menu for that Monitoring Check and select "Edit".
Remember to save any changes or click the back arrow at any point to discard.
Delete a Monitoring Check
To stop monitoring an API Endpoint, select the App, expand "Diagnostics" and select "Monitoring Checks" in the left hand menu. Expand the context menu for that Monitoring Check, select "Delete" and then click "OK" when prompted.