Getting started
To enable Crash Reporting & Diagnostics for an app, enable the Diagnostics feature within Kumulos, add monitoring checks to track the performance of the services your app depends on to function and integrate an SDK into your app project to track unhandled exceptions in your app.
Enable Diagnostics
Create a Client
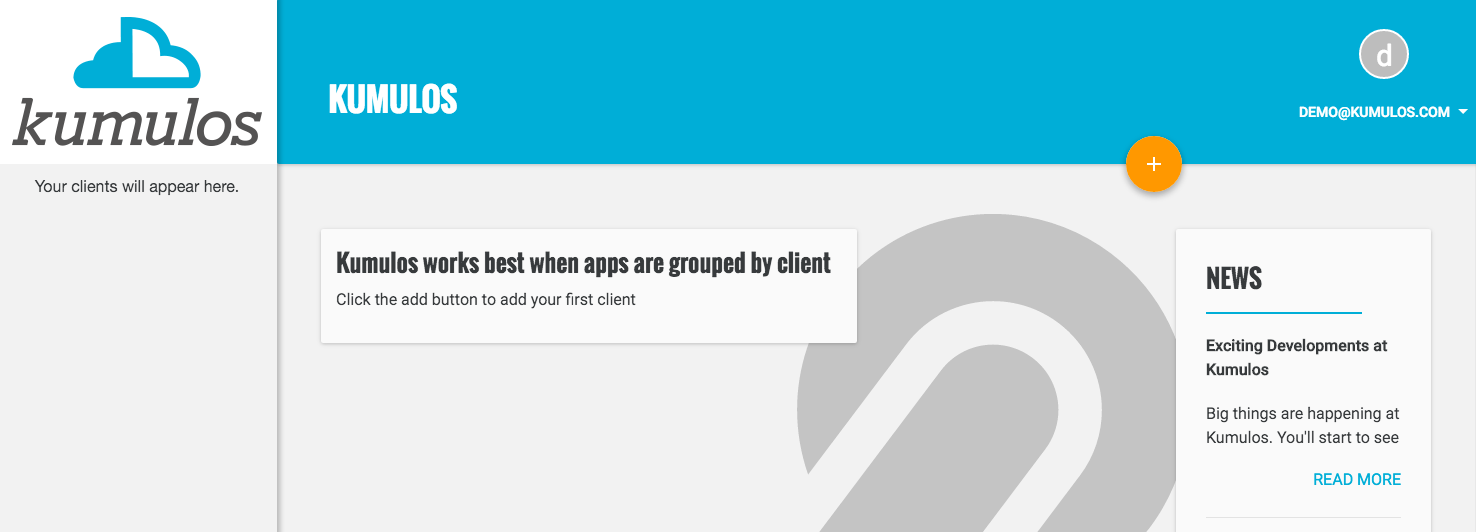
Kumulos groups your Apps under Clients, usually the name of the company whose app you are building or optimizing. To add a new client click the primary action button from your agency console.
Fill in the name of the client. Click "Save" when done.
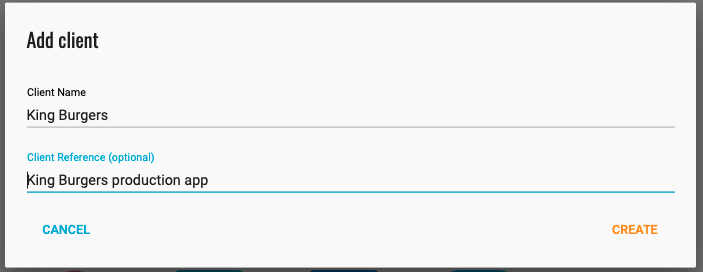
The Client reference field is an optional field that will allow you to easily identify the app in API responses. You will now be redirected to the client dashboard.
Add an App
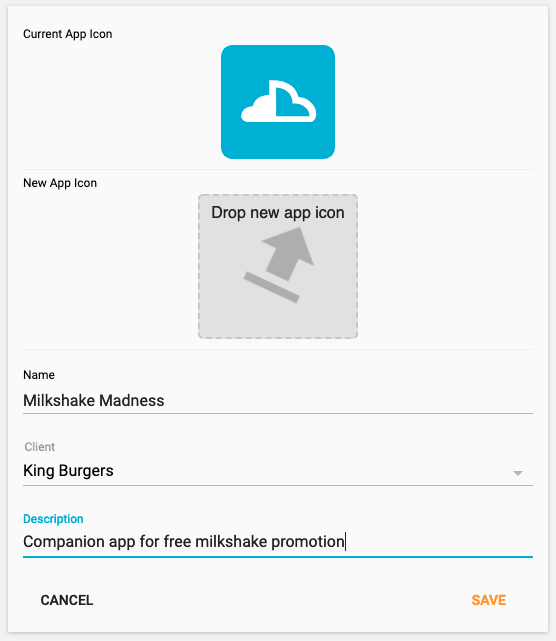
Now, you can add an app for that client by clicking the primary action button. Fill in the name of the App, and optionally, add a brief description and upload an icon. Click "Save" when done.
You will now be redirected to the dashboard for that app where you can enable Crash Reporting.
Enable Diagnostics
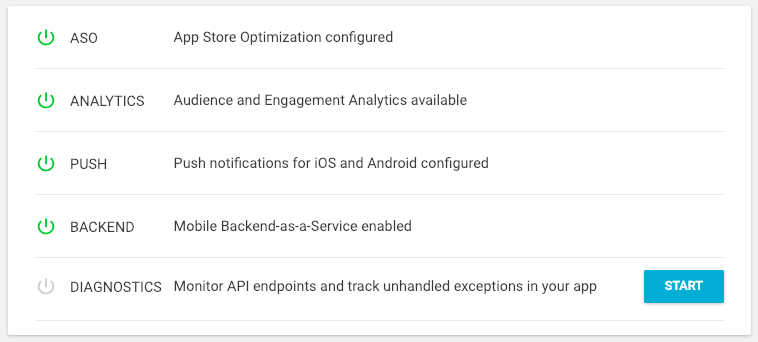
To start a 30 day free trial, either select Diagnostics from the left menu or click the Start button next to Diagnostics on the App Dashboard.
You will now see some more information about the Crash Reporting & Diagnostics feature.
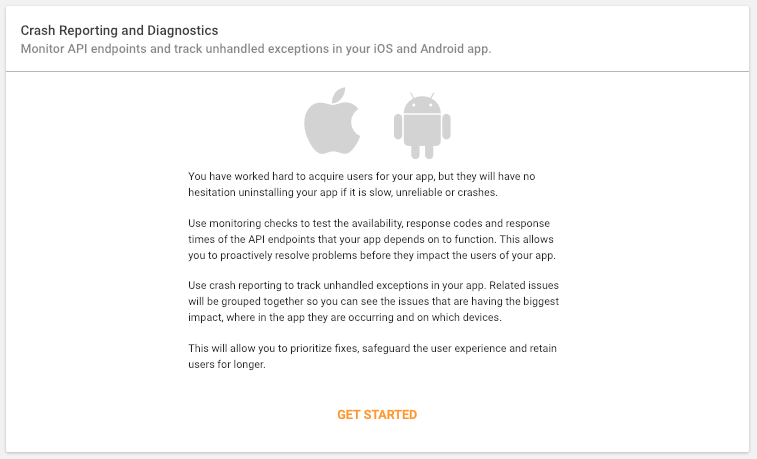
Click Get Started when prompted. You will be asked to confirm that you wish to begin a 30 day free trial.
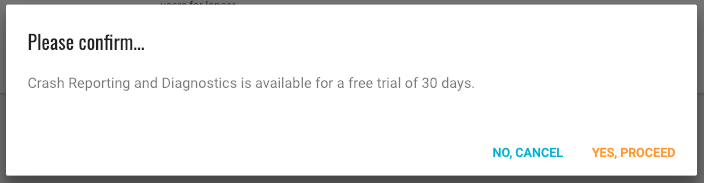
Click Yes, proceed when prompted. Your 30 day trial of Crash Reporting & Diagnostics will now begin.
Add Monitoring Checks
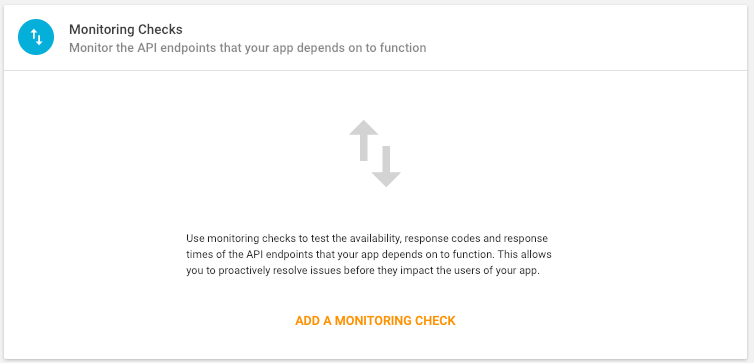
To start tracking the performance of the services your app depends on to function, add a monitoring check for each of the API Endpoints your app relies on and communicates with. Select "Monitoring Checks" and then click the "Add a Monitoring Check" or the Primary Action Button.
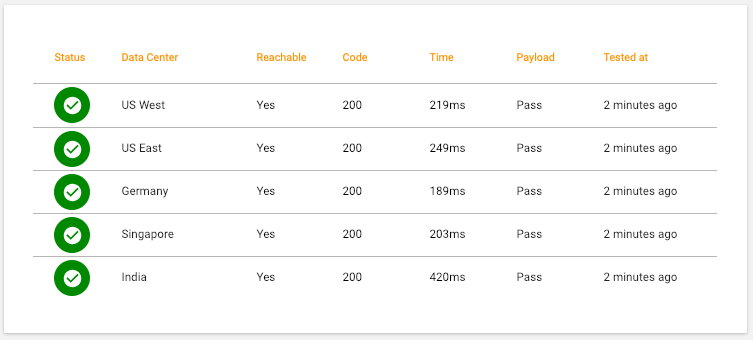
Use the wizard to enter details of the API Endpoint (URL, Request Method etc), any HTTP Headers (e.g. Authorization), Warning and Critical Thresholds for Response Time and optionally a JSON schema against which the payload will be validated. Then, within 5 minutes, you will see detailed results from around the world.
Download and Integrate an SDK
To start tracking unhandled exceptions in your app, download and integrate an SDK into your app. Select the appropriate SDK(s) from the list to view the integration guide for and download that SDK.
Follow the integration guide for that SDK to initialize the Kumulos client in your app project. Please note that you will need the API Key and Secret Key shown on the App Dashboard to do this.
Crash reporting is not enabled by default. To enable this feature, simply modify your Kumulos initialization to include enabling crash reporting...
Note that crash reporting is not available whilst connected to a debugger, but it does work with debug builds.
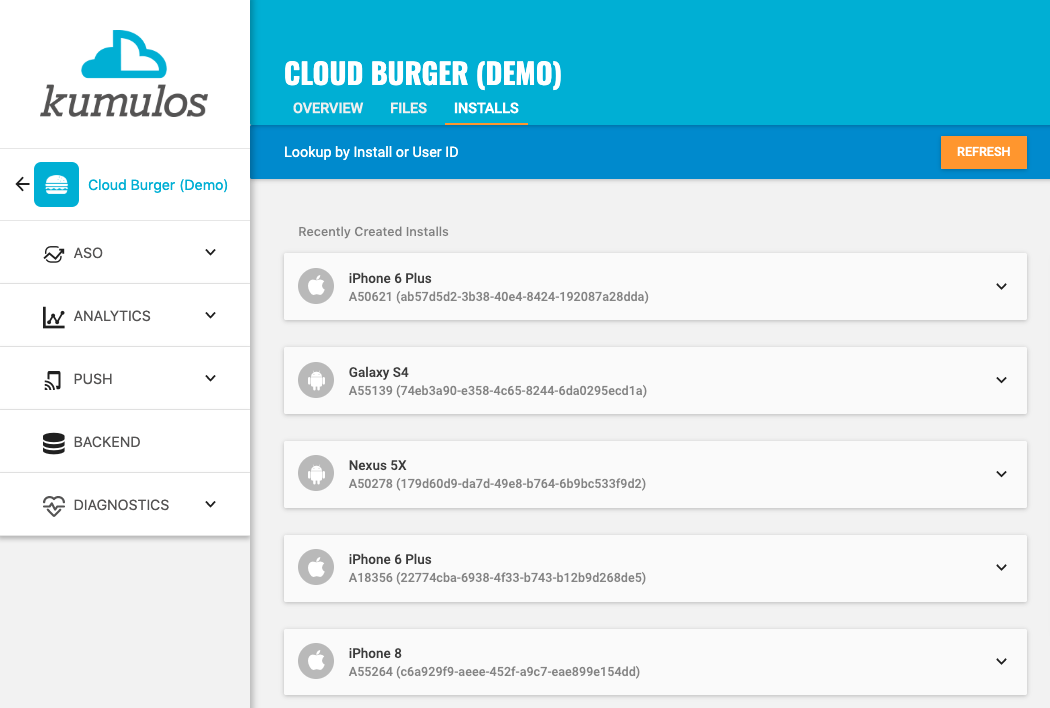
Checking installs of your App
When you run your app on a simulator or install your app on a device, you can check that the SDK has been initialized correctly by selecting the app and clicking the Installs tab to see the ten most recent installs of your app. Click on any install to see more information.
If you experience any difficulties integrating an SDK or initializing the Kumulos client, please don't hesitate to contact support who are standing by to help!
That's it! Unhandled exceptions that lead to crashes (along with any caught exceptions you choose to report) will now be recorded automatically and shown in your console. However, we recommend you trigger a crash to verify everything is working.
Read on for details of how to prioritize and resolve issues...