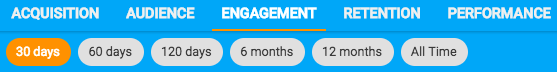
Engagement
The Engagement tab shows - for the last 30 days, 60 days, 120 days, 6 months, 12 months or All Time - when during the day and week users are opening the app, how frequently they open the app and how long they typically use the app for. If you have enabled Push Notifications it will also show how many push notifications have been sent and opened.
Changing Time Period
By default, the Engagement tab shows active installs during the last 30 days. This can be changed by clicking 60 days, 120 days, 6 months, or 12 months as appropriate. All charts in the Engagement tab will then update to reflect activity in the selected time period.
Session Definition
Kumulos records sessions based on application foreground and background events. When an app enters the background, Kumulos will wait for a configurable idle period. If there are no more foreground events during that idle period, the current session will be closed.
You can configure the idle period to suit your app's use-case. By default the idle period is 40 seconds of inactivity. The idle period does not count towards session duration calculations.
To adjust the idle period, please see the appropriate integration guide for your SDK (e.g. Android).
Session Distribution
The session distribution bubble chart shows when during the day and on which days of the week the most sessions occur (i.e. when during the week is your app used the most). The larger the circle, the more sessions there were started in that hour. Hover over any circle to see how many sessions were started in that hour.
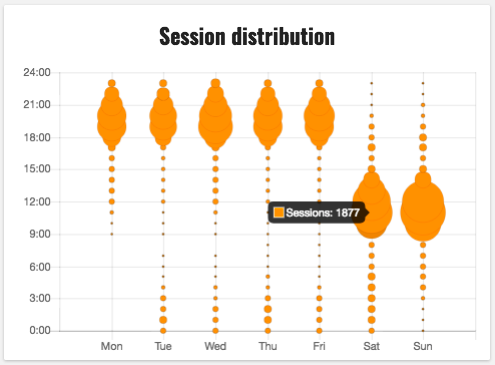
Sessions are recorded according to the local time of each device on which the app is installed.
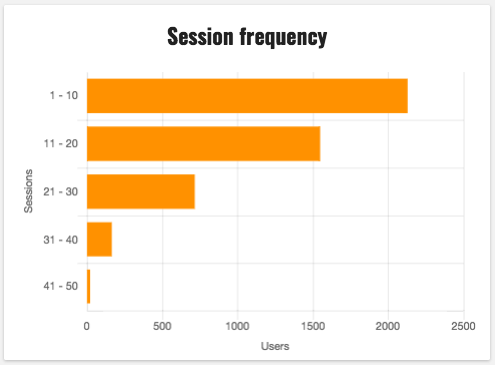
Session Frequency
The session frequency chart cohorts users into five equal-width bins according to how many sessions they had during the time period. The width of the bins varies depending on the maximum number of sessions per user in that time period. This enables you to see both the most common usage profile for your app and how many users fall into each usage profile (e.g. how many whales, dolphins and minnows an app has).
Sessions Per Day
The sessions per day chart shows how many sessions occurred for each day in the time period, allowing you to quickly see trends of how often the app is being used.
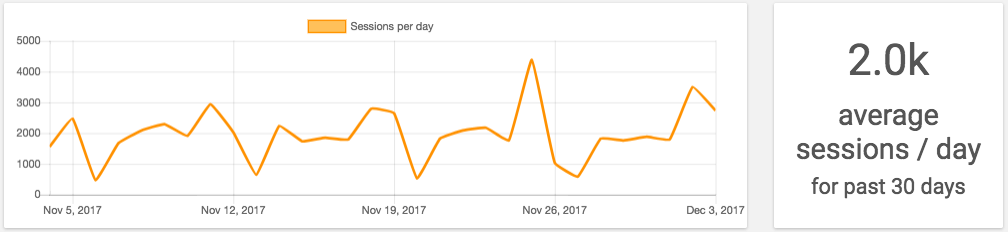
The widget to the right shows the average number of sessions per day for the time period.
Session Length
The session length chart shows the median session length for each day in the time period, allowing you to quickly see trends of how long the app is, on average, used for.
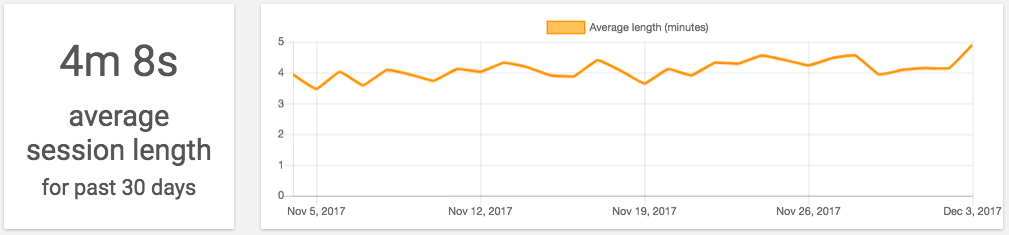
The widget to the left shows the median session length for the selected time period.
Push Open Rates
If you have enabled Push Notifications you can see the total number of notifications that have been sent and how many of these have been opened in the selected time period. You can compare this to the active installs chart above to see the impact Push Notifications has had on activity.
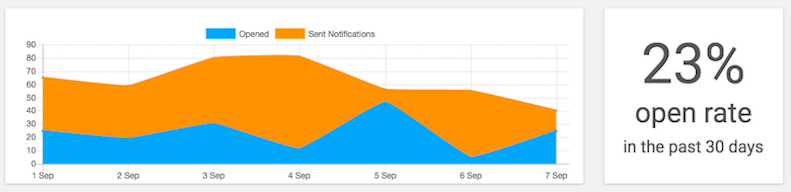
The widget to the right shows the average open rate in the selected time period allowing you to see how this changes over time.