Dashboard
Once enabled, the Diagnostics Dashboard gives you complete visibility of the technical performance of your app and all the services it depends on to function so you can be proactive and minimize the impact of any problems on your audience such as crash reports caused by an API Endpoint outage.
The Dashboard will update every 5 minutes, but clicking the refresh button will update immediately.
Overview
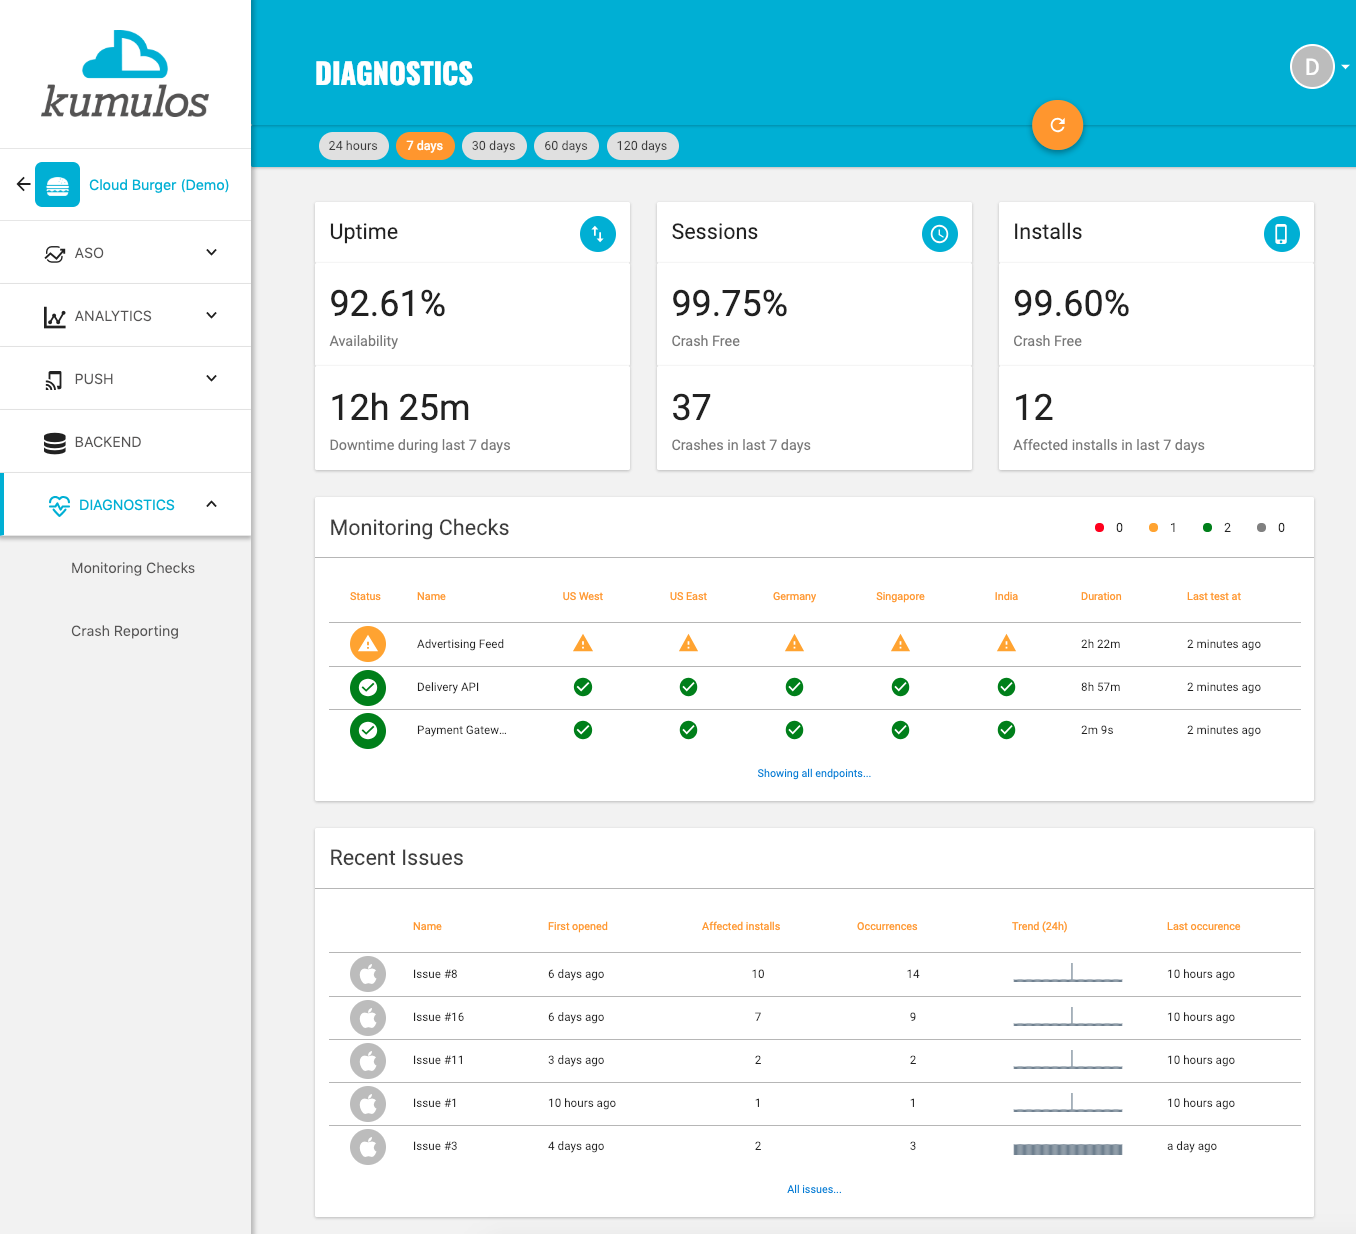
The widgets at the top of the Dashboard give you an immediate overview of the health of your app.
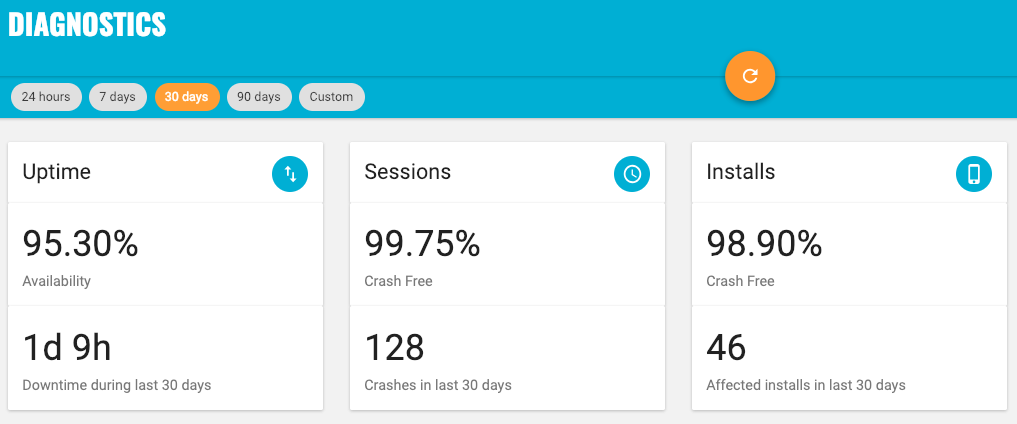
By default, these widgets will show the health of your app over the last 24 hours, but you can change this to the last 7 days (1 week), 30 days (1 month) or 90 days (1 quarter). Alternatively, select Custom and enter a start and end date to see this over a period of time up to 180 days (6 months).
Uptime shows the percentage of time that all of the API Endpoints you are monitoring were Available during the selected time period as well as the absolute downtime (the duration of time where one or more API Endpoints had an Outage) over the same time.
Sessions shows the percentage of Crash Free Sessions in the selected time period as well as the absolute number of sessions that experienced a crash during that time.
Installs shows the percentage of Crash Free Installs in the selected time period as well as the absolute number if installs that experienced one or more crash during that time.
Monitoring Checks
The Monitoring Checks table shows the current status of the API Endpoints you are monitoring.
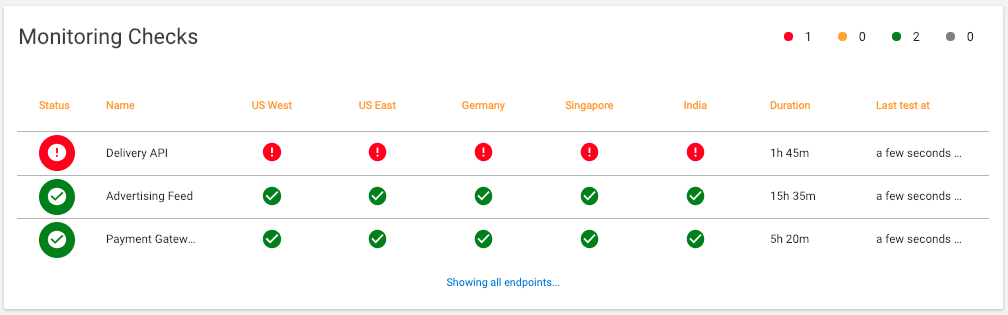
For each API Endpoint, you can see the overall Endpoint status as well as the status from each data centre. You can see how long the Endpoint has been in that status and when it was last tested. Click on any Endpoint to see more detailed test results.
At the top of the table you can see the count of Endpoints by status. API Endpoints are ordered in the table by Status with those Endpoints with an Outage or Partial Disruption appearing first. The table will show up to 5 API Endpoints. Click on the link at the bottom to view the status of all Endpoints.
Recent Issues
The Recent Issues table shows those issues where a crash has occurred recently.
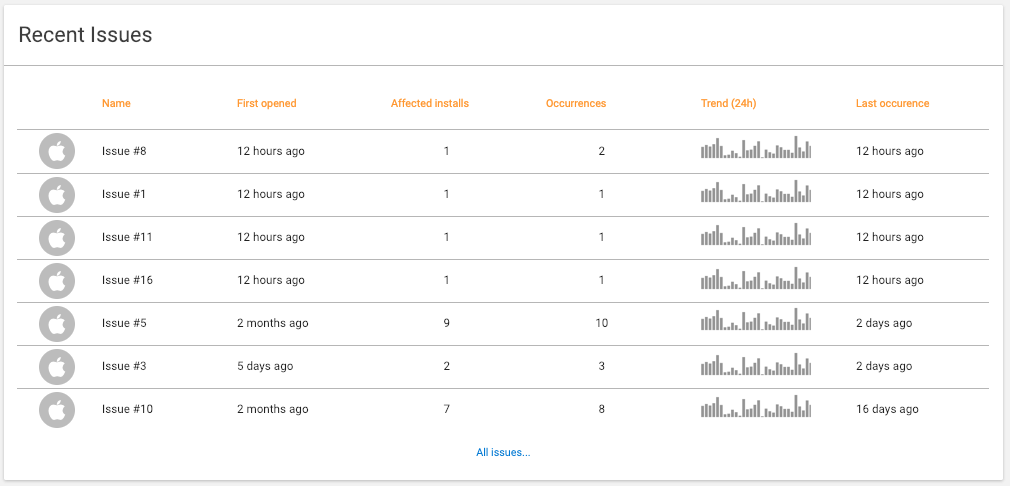
For each issue, you can see when it was first opened, how many installs it is affecting, how many times it has occurred and when it last occurred. The spark line will show the trend of occurrences over the last 24 hours so that if you have an API Endpoint outage, you can quickly see any crash reports that are occurring because of this.
The table will show up to 10 Issues. Click on the link at the bottom to view all Issues.