Conversion
The Conversion tab lets you add funnels to track and optimize conversion through key user journeys in your app. With funnels, you can track how many people start different user journeys in your app, how many complete the journey and convert as well as how long it takes on average to do this.
Funnels also show you where in the journey users drop-off and how long it takes to progress through each step so you can optimize the user journey to increase conversion and decrease the time taken.
To use funnels, your app must send custom analytics events to Kumulos. See the integration guide for the appropriate SDK(s) for your app. For example: Swift SDK and Android SDK.
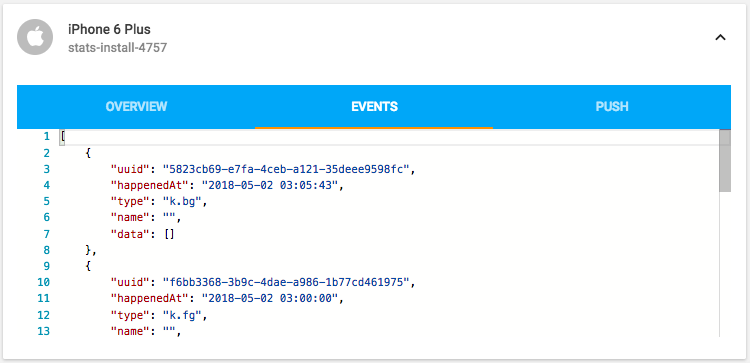
When you run your app on a simulator or install your app on a device, you can check that the SDK is recording events correctly by selecting the app and clicking the "Installs" tab to see the ten most recent installs of your app. Click on any install and then click on the "Events" tab.
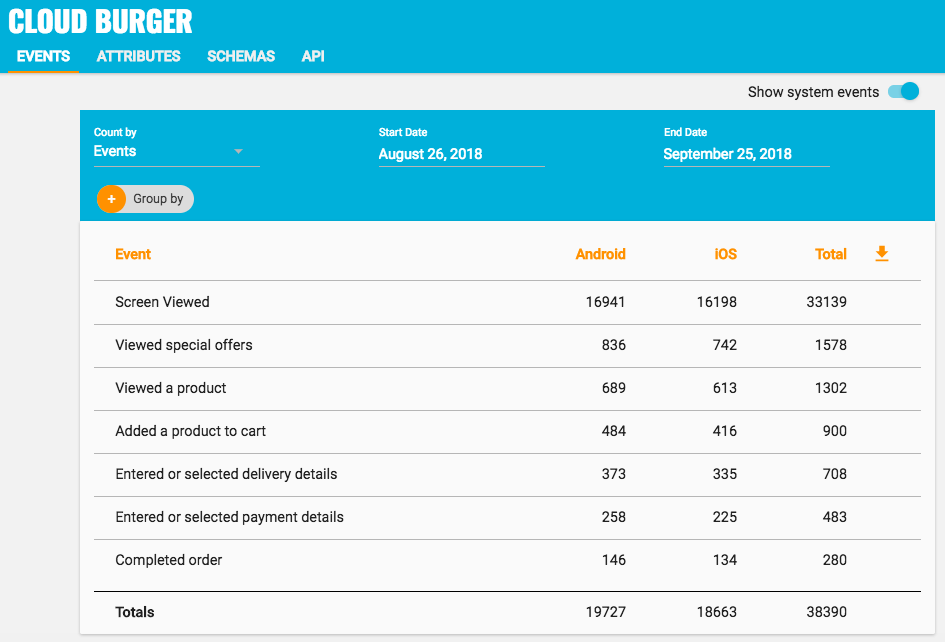
Alternatively, to see counts of all analytics events, including system events such as opened a push notification, recorded by installs of the app in the last 30 days, expand 'Analytics' and click 'Explore' in the left menu. For comparison, the total number of sessions in the same period is shown.
Adding a Funnel
To add a funnel, select the App and then in "Analytics" go to the "Conversion" tab and click the Add icon. Give the funnel a title and a description.
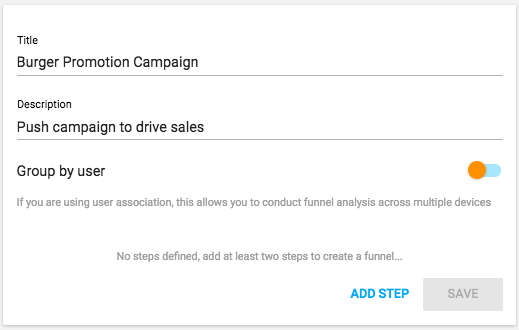
If you have used user association in your app, toggle the "Group by user" option. This will associate events by user allowing them to convert even if they complete steps on different devices (e.g. phone and tablet). If you have not used user association, events are associated by install (i.e. to convert, all steps must be completed on same device).
To group by user, your app must associate a user with the Kumulos install id. See the integration guide for the appropriate SDK(s) for your app. For example: Swift SDK and Android SDK.
Adding steps to a Funnel
A funnel must have two or more steps. Click "Add Step" to add a step to your funnel. Select the analytics event from the drop down menu and then give the event a friendly name (that will be displayed when you visualize the funnel).
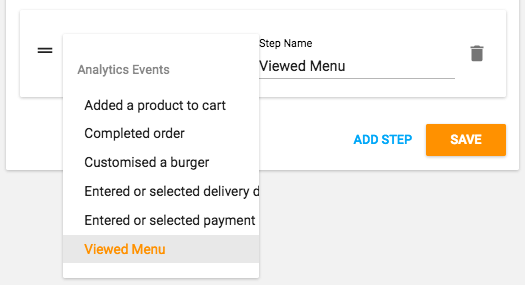
Repeat this process to add other steps to the funnel. You can re-order steps by clicking the anchor icon and dragging the step to a new position. You can delete steps by clicking the trash can icon.
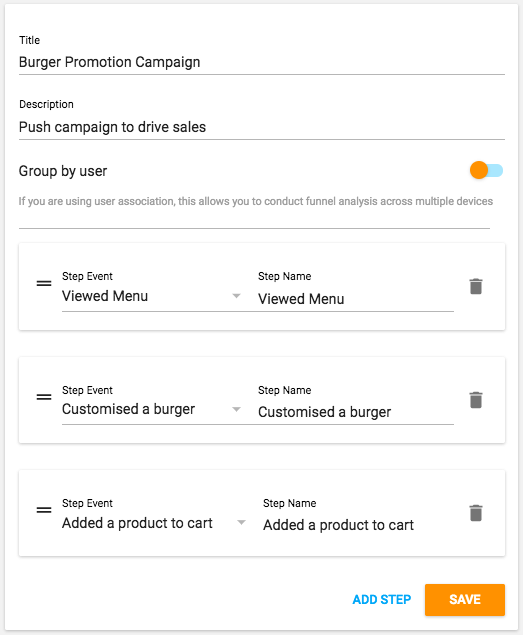
Click "Save" when done to explore conversion.
Viewing a Funnel
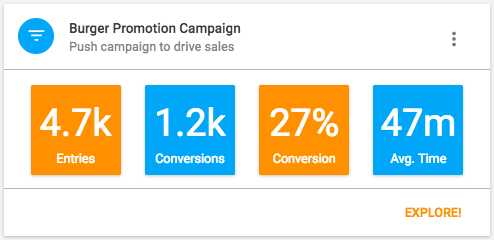
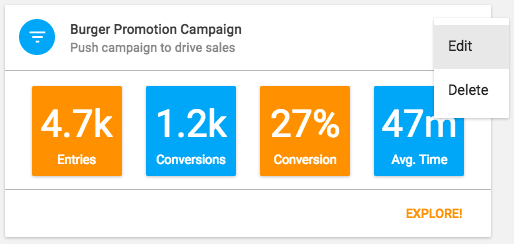
To view a funnel, select the App and then in "Analytics" go to the "Conversion" tab. Each funnel will be listed with a summary showing:
- How many users/installs entered the funnel (completed the first step) in the last 30 days
- How many users/installs converted (completed all steps) in the last 30 days
- The conversion rate (percentage of users/installs)
- The predicted average time through funnel (see below)
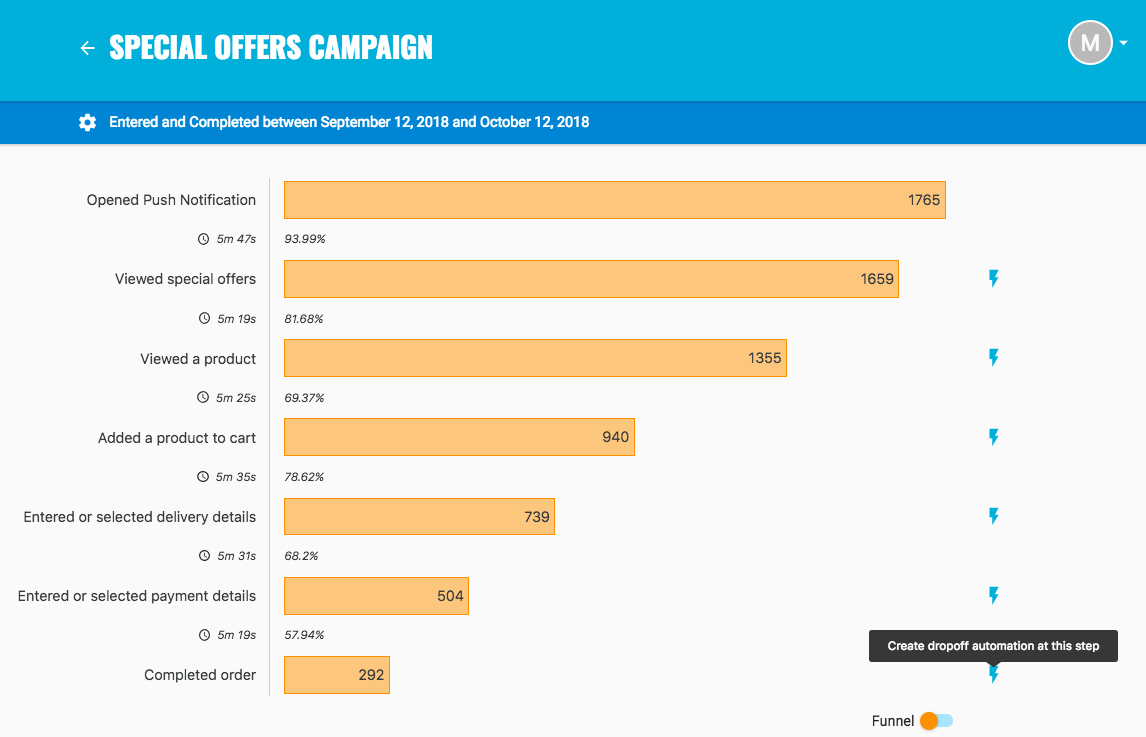
Exploring Conversion
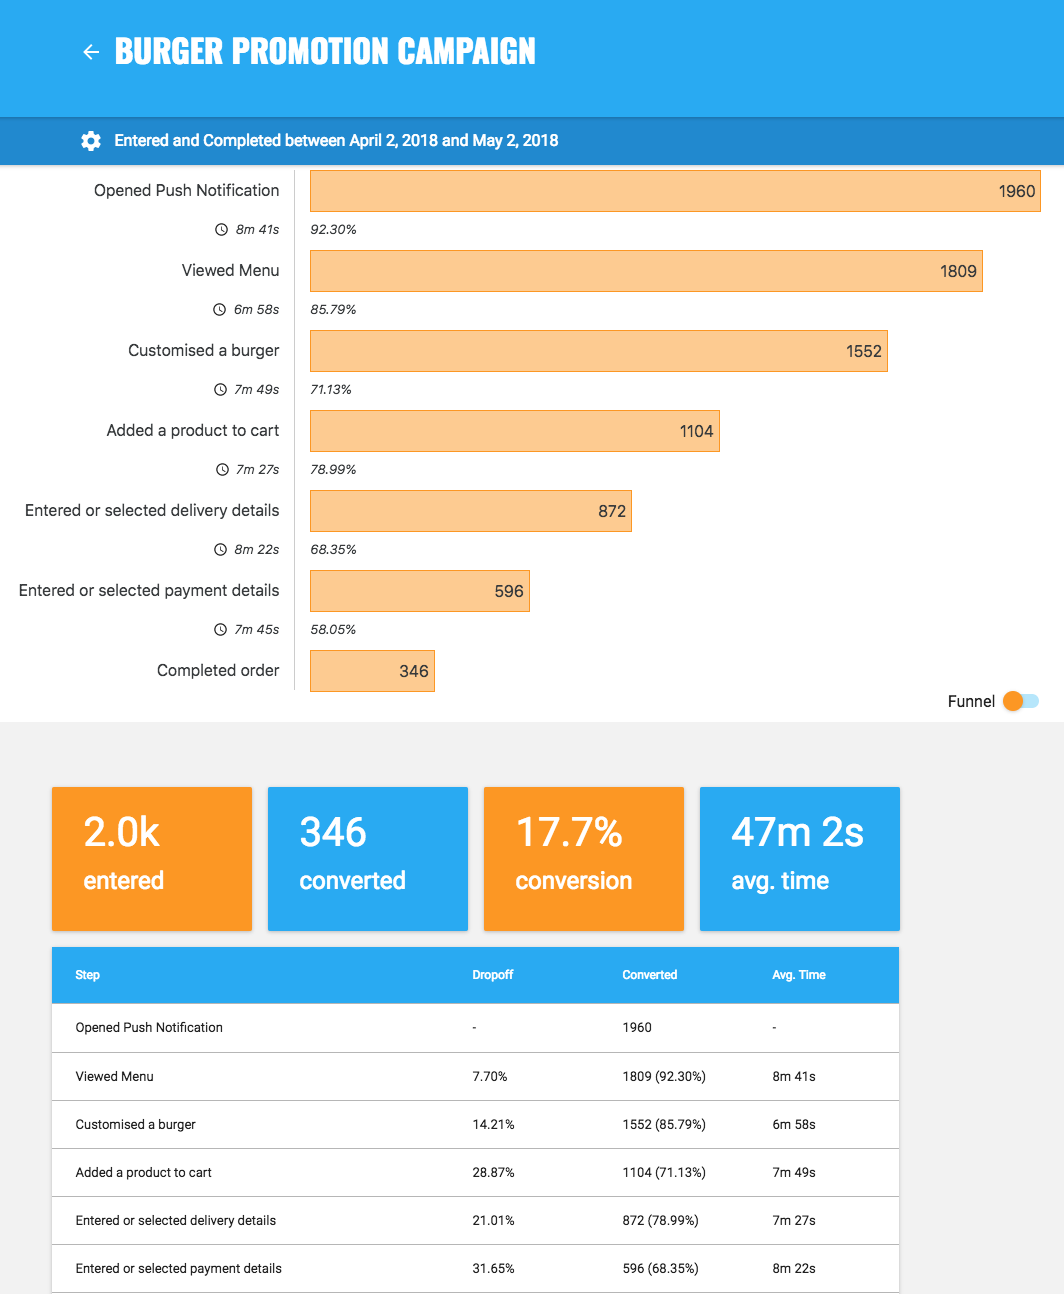
To explore conversion in more detail, click "Explore" to see how many users/installs completed each step of the funnel, the percentage of users who progressed to the next step and the average time taken to do this.
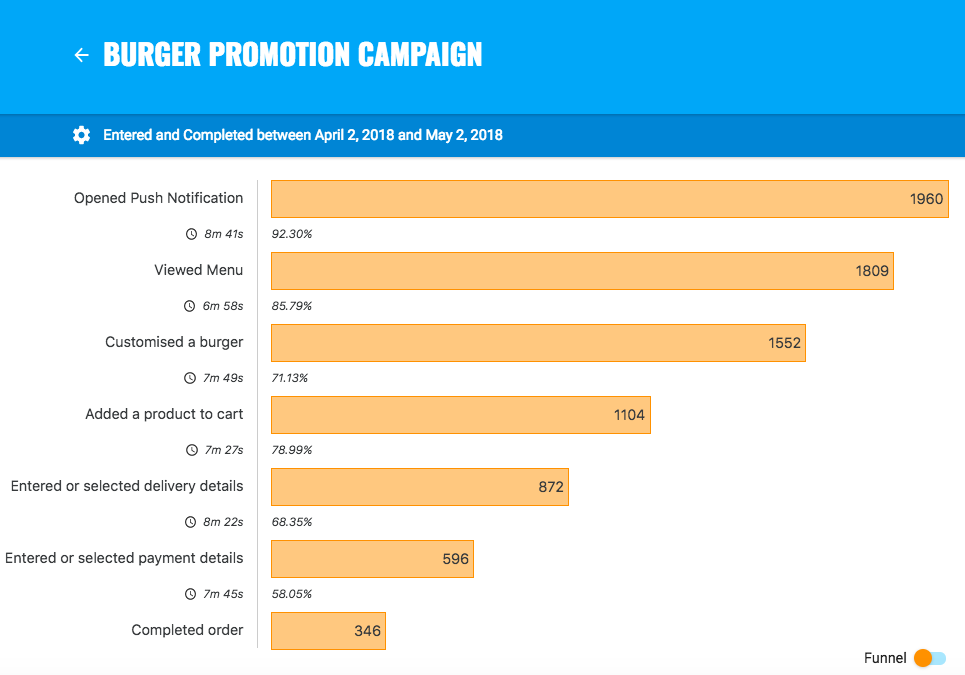
Scroll down to see a summary of the funnel:
- How many users/installs entered the funnel (completed the first step) in the last 30 days
- How many users/installs converted (completed all steps) in the last 30 days
- The conversion rate (percentage of users/installs)
- The predicted average time through funnel (see below)
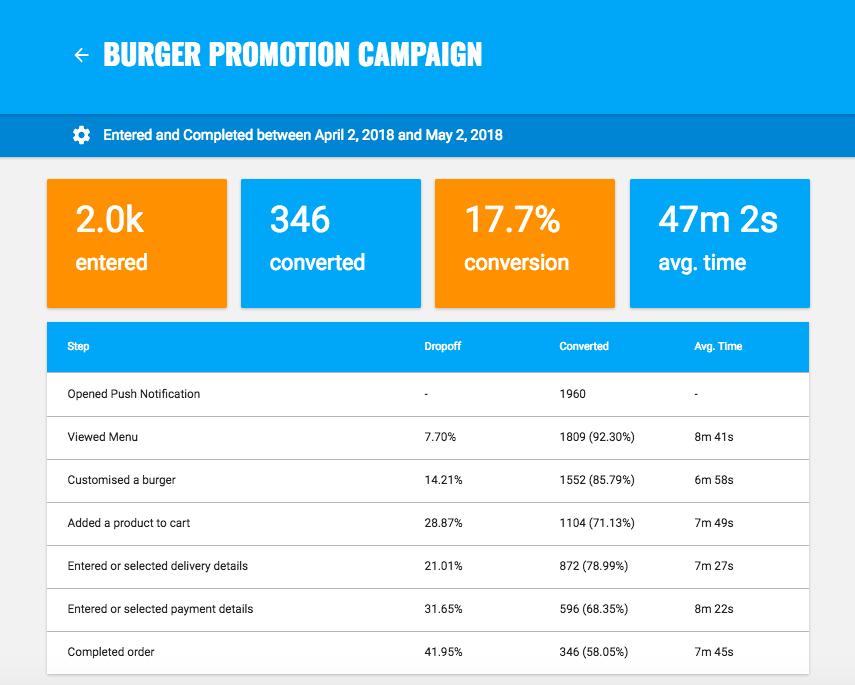
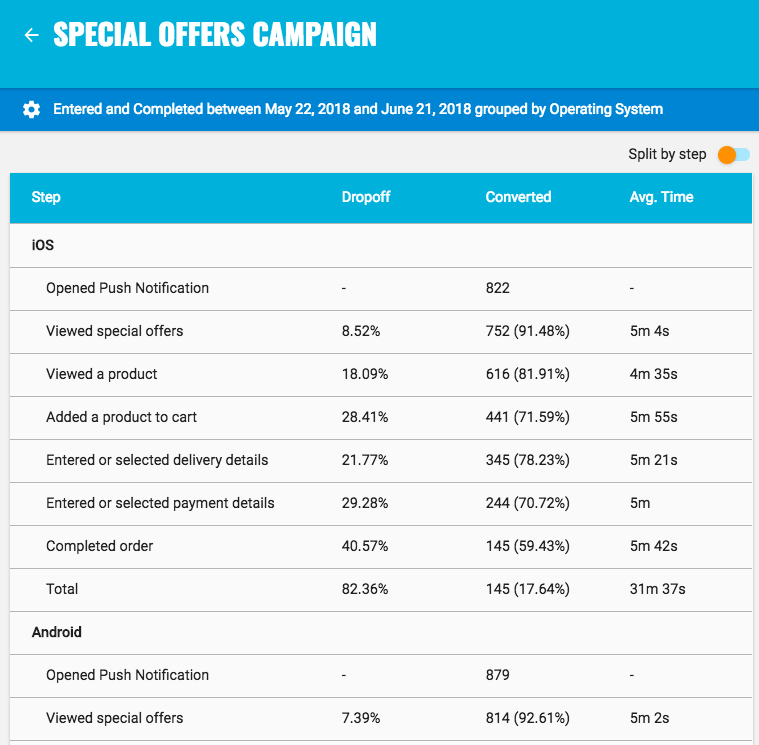
There is also a table showing, for each step:
- The percentage drop-off from the previous step
- The absolute and percentage conversion from the previous step
- The average time taken to convert from the previous step
Predicted average time
The predicted average time through the funnel is the sum of the average times taken to complete each step in the funnel (not just the average times of only those who completed the funnel). This lets you see which steps are taking all users a long time to complete and can likely be optimized.
To optimize a user journey to improve conversion, start with the steps that have the highest drop-off and then the steps that take the longest time to complete. Consider how each step can be improved.
Filtering a Funnel
By default, the funnel shows how many users/installs entered and completed the funnel within the last 30 days. To change this, click the settings cog icon.
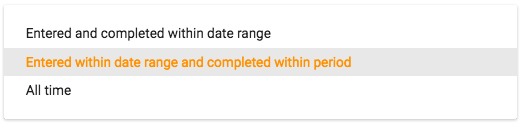
First, choose how to filter the funnel:
- Entered and completed within date range
- Entered within date range and completed within period
- All Time (no filter)
Entered and completed within date range
If you have selected "Entered and completed within date range" you must then select the start and end date of the date range. This can be useful for measuring a time-limited promotional campaign.
Note that a user/install must complete all steps within the date range to count towards conversion. If they enter in the date range but do not complete one or more steps until after the end date, they will contribute to the drop-off after the last step they completed before the end date.
Entered within date range and completed within period
If you have selected "Entered within date range and completed within period" you must then select the start/end date of the date range and the maximum period of time (minutes, hours or days) within which they can convert. This can be useful for measuring conversion of leads generated within a calendar month over different time periods (for example).
Note that a user/install must complete all steps within the maximum time period after they entered the funnel (completed the first step) to count towards conversion. If they enter in the date range but do not complete one or more steps until after the maximum time period, they will contribute to the drop-off after the last step they completed within the maximum time period.
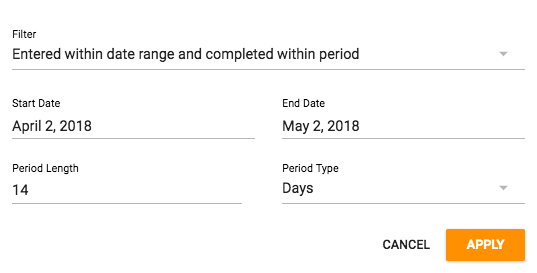
Click "Apply" to apply these new filters to the funnel.
Grouping
By default, the funnel shows how many users/installs entered and completed the funnel within the last 30 days. To see how different cohorts compare, click the settings cog icon and under 'Group By' select a dimension.
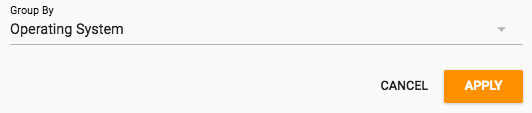
Click "Apply" to apply to redraw the funnel and compare cohorts.
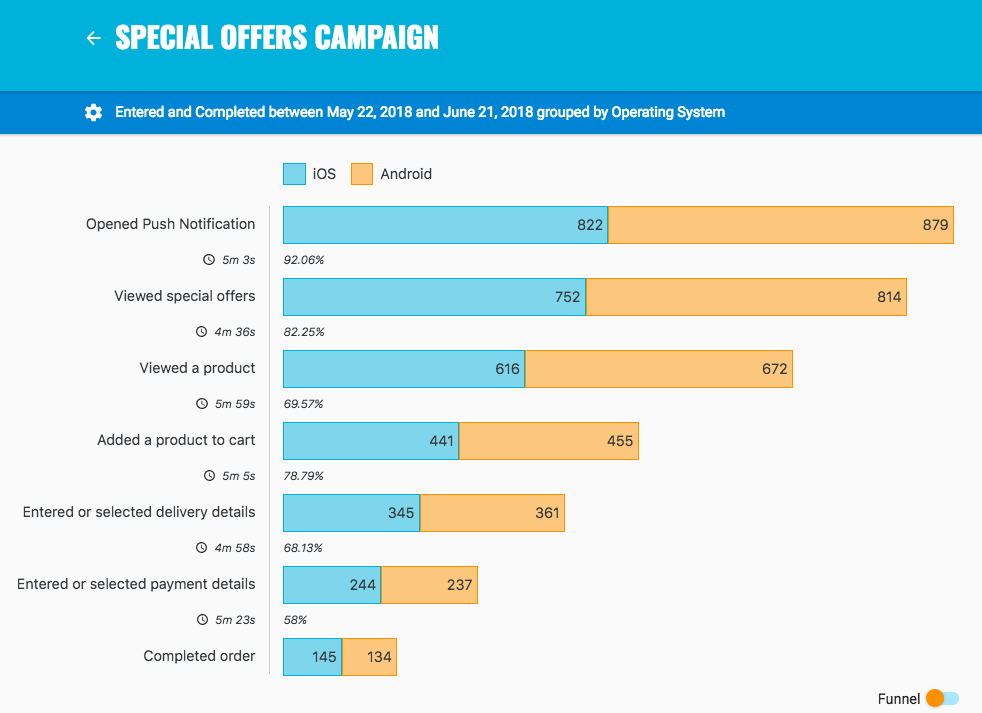
Operating system is the only dimension currently available to cohort users/installs but it will soon be possible to cohort by other dimensions such as app version, user attributes or metadata from the events themselves.
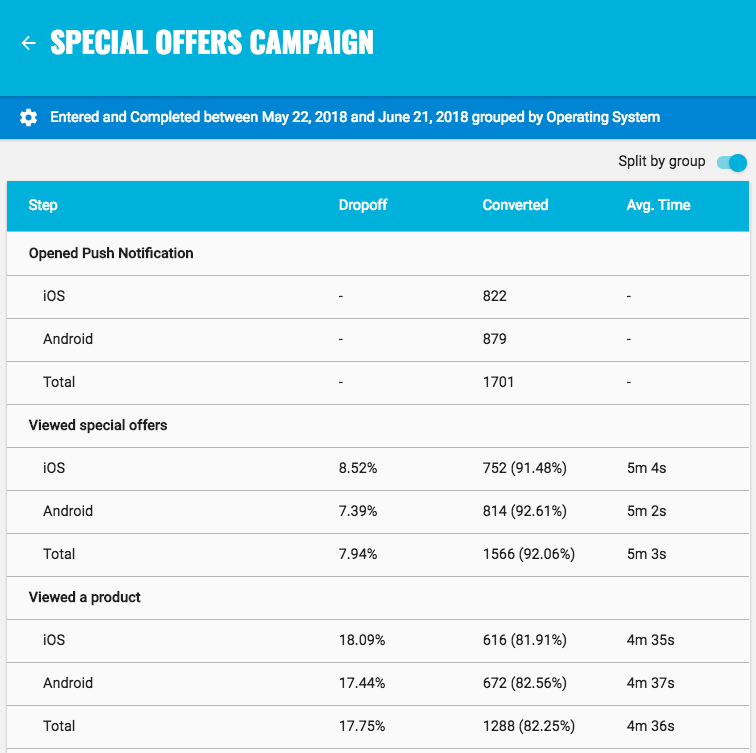
Split by group
The table will now be split by group showing the percentage drop-off, absolute and percentage conversion and the average time taken to convert from the previous step for that group throughout the entire funnel.
This enables you to see the performance through the entire funnel for each group.
Split by step
To compare the relative performance of different groups at each step, click the "Split by step" toggle. The table will now show for each step, the percentage drop-off, absolute and percentage conversion and the average time taken to convert from the previous step for each group.
To change the table back to see the performance through the entire funnel for each group, click the "Split by group" toggle.
Changing Visualization
By default, the funnel is visualized as a horizontal bar chart. To change the visualization to a literal funnel, click the "Funnel" toggle.
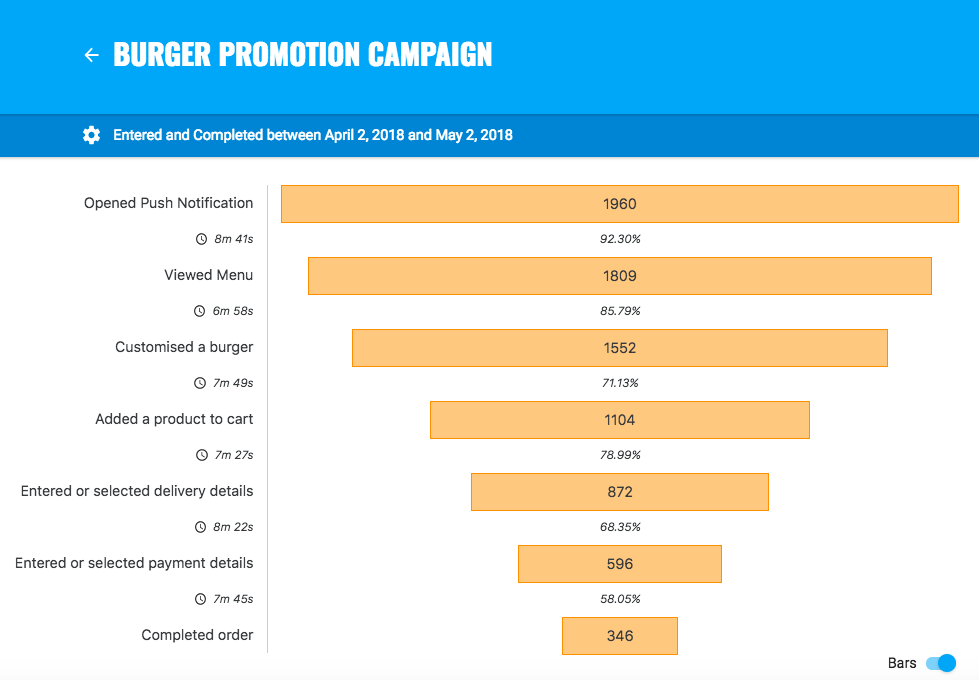
To change the visualization back to a horizontal bar chart, click the "Bars" toggle.
Targeting Drop-Offs
You can target users who do not complete a user journey or funnel within a certain period of time, for example to encourage users to complete the onboarding flow and retain them within the app or to target users who abandon their shopping cart. Select 'Drop-off triggered' as the trigger event.
To do this, click the automation (lightning) icon next to the step that you want users to complete to create a new automation with a rule that has the funnel drop-off trigger pre-populated.
Give the automation a name and select the timeout when the trigger should fire if a user does not complete the funnel step within that time of the previous funnel step. You can set the timeout in minutes, hours or days.
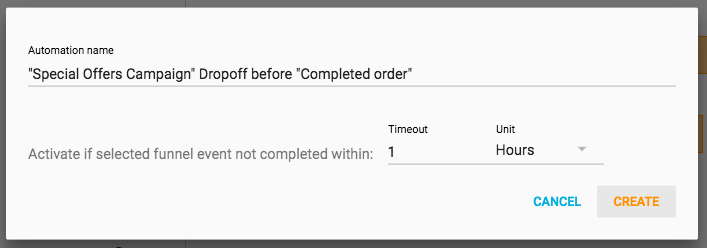
Click 'Create' to create to define the audience and add an action such as sending a push notification.
Editing a Funnel
To edit a funnel name or description and/or edit the steps in the funnel, select the App and then in "Analytics" go to the "Conversion" tab. Expand the context menu and select "Edit".
Remember to save any changes or click back to discard.
Deleting a Funnel
To delete a funnel, select the App and then in "Analytics" go to the "Conversion" tab. Expand the context menu and select "Delete" then click "OK" when prompted.