Performance
If you have used the App Build Mobile Backend-as-a-Service (MBaaS) feature in Kumulos, to store and host data and content for the app, then the performance tab will show how this is performing.
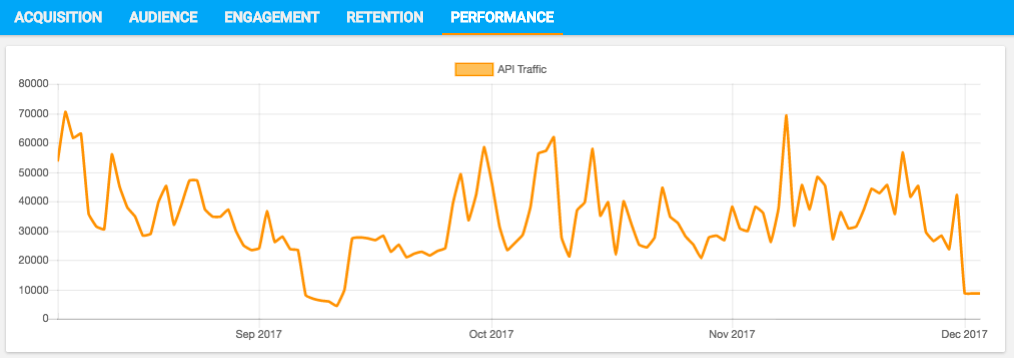
API Traffic
The API Traffic chart shows the volume of API calls made by installs of the app to Kumulos each day over the last 120 days.
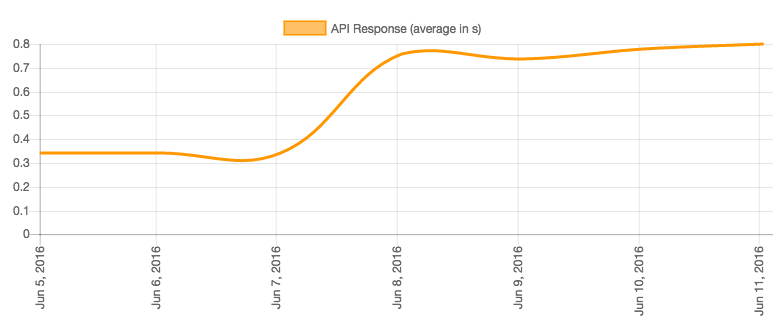
Processing Time
The API Response chart shows the average processing time, in seconds, of API calls made each day over the last 120 days. If this is increasing, then you may need to revisit the data model for your app and/or consider adding indexes where appropriate. Don't hesitate to contact support who are more than ready to help advise you on this.
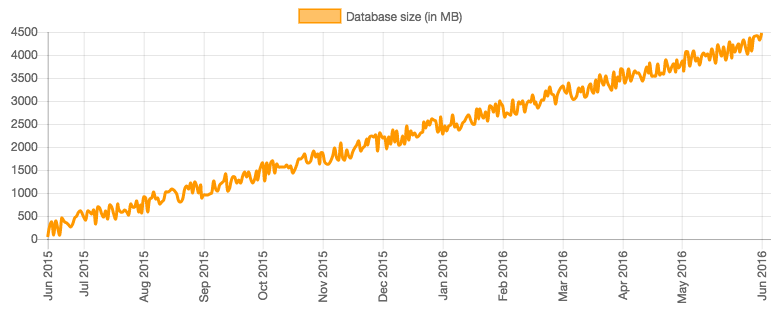
Database Storage
The Database size chart shows, for each of the last 120 days, the cumulative amount of data stored in Kumulos by users of the app.